Streamlit开发手册

基本概念
数据流 缓存 UI组件 App模型
快速上手教程
前置要求 设置虚拟环境 导入Streamlit 添加应用标题 添加数据 使用魔术方法 绘制折线图 绘制地图 使用复选框切换数据的显示 使用列表选择框 将组件放在侧栏 显示进度
教程 - 数据浏览应用
创建应用 读取数据 缓存 查看原始数据 绘制直方图 在图上叠加数据 使用滑杆过滤结果 使用按钮切换数据 整合
教程 - 远程运行Streamlit
准备工作 SSH及端口转发 在云实例上安装Streamlit 远程运行你的代码 编辑远程脚本
高级概念
数据显示与样式 插入编外数据 元素动画效果 向图表添加数据 返回Stream调用的值 高级缓存
API参考手册
魔术方法 st.title - 显示应用标题 st.header - 显示主标题 st.subheader - 显示副标题 st.text - 显示文本 st.markdown - 显示markdown文本 st.code - 显示代码块 st.write - 通用显示方法 st.dataframe - 显示可交互数据帧 st.table - 显示静态数据表 st.json - 显示JSON对象 st.pyplot - 显示matplotlib图表 st.altair_chart - 显示Altair图表 st.vega_lite_chart - 显示vega-lite图表 st.plotly_chart - 显示plotly图表 st.bokeh_chart - 显示Bokeh图表 st.deck_gl_chart - 显示Deck.GL图表 st.graphviz_chart - 显示graphviz图表 st.line_chart - 显示折线图 st.area_chart - 显示区域图 st.bar_chart - 显示棒状图 st.map - 显示地图 st.image - 显示图像 st.audio - 显示音频播放器 st.video - 显示视频播放器 st.button - 显示按钮 st.checkbox - 显示复选框 st.radio - 显示单选框 st.selectbox - 显示列表选择框 st.multiselect - 显示列表多选框 st.slider - 显示滑动拉杆 st.text_input - 显示文本输入框 st.number_input - 显示数字输入框 st.text_area - 显示多行文本输入框 st.date_input - 显示日期输入框 st.time_input - 显示时间输入框 st.echo - 显示应用源代码 st.progress - 显示进度 st.spinner - 显示执行状态 st.balloons - 显示庆祝气球 st.error - 显示错误信息 st.warning - 显示警告信息 st.info - 显示提示信息 st.success - 显示成功信息 st.exception - 显示异常信息 st.empty - 添加占位符 st.help - 显示帮助信息 st.get_option - 读取配置项的值 st.set_option - 设置配置项的值 st.cache - 函数缓存装饰器 dg.add_rows - 追加数据行
命令行参考手册
streamlit help - 查看帮助信息 streamlit run - 运行应用 streamlit config show - 查看配置选项 streamlit cache clear - 清理缓存 streamlit docs - 查看文档 streamlit version - 查看版本
常见问题解答
如何更改端口?
在线工具推荐: Three.js AI纹理开发包 - YOLO合成数据生成器 - GLTF/GLB在线编辑 - 3D模型格式在线转换 - 可编程3D场景编辑器

st.plotly - 显示Plotly图表

streamlit的plotly方法显示可交互的Plotly图表。要在Streamlit 中显示Plotly图表,只需要用plotly_chart调用替代原本 的Plotly的py.plotpy.iplot调用。

Plotly是一个Python的图表库。该方法的参数基本遵循Plotly的plot() 函数的定义。你可以在这里查看详细信息:https://plot.ly/python。

方法原型

streamlit.plotly_chart(figure_or_data, width=0, height=0, sharing='streamlit', **kwargs)

参数:

  • figure_or_data :plotly图表数据或matplotlib绘图面板。如果是 matplotlib绘图面板,会将其转化为Plotly绘图面板然后再显示
  • width:图表宽度,单位为像素,或者设置为0,表示使用全部宽度
  • height:图表高度,单位为像素,或者设置为0,表示使用默认高度
  • sharing:共享模式,可选值:streamlit、private、secret、public。设置为 streamlit将图表以及依赖插入Streamlit应用,这意味着可以离线 运行。使用其他设置会发送到Plotly的服务器,然后嵌入Streamlit应用。
  • **kwargs:Plotly的plot()方法接受的其他参数

示例代码

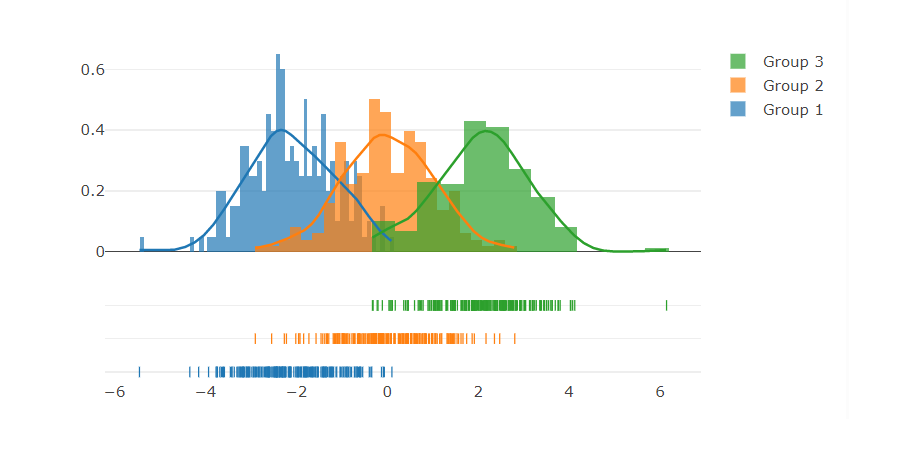
下面的示例直接取自Plotly官网示例:

>>> import streamlit as st
>>> import plotly.figure_factory as ff
>>> import numpy as np
>>>
>>> # Add histogram data
>>> x1 = np.random.randn(200) - 2
>>> x2 = np.random.randn(200)
>>> x3 = np.random.randn(200) + 2
>>>
>>> # Group data together
>>> hist_data = [x1, x2, x3]
>>>
>>> group_labels = ['Group 1', 'Group 2', 'Group 3']
>>>
>>> # Create distplot with custom bin_size
>>> fig = ff.create_distplot(
...         hist_data, group_labels, bin_size=[.1, .25, .5])
>>>
>>> # Plot!
>>> st.plotly_chart(fig)

效果如下:

plotly