Streamlit开发手册

基本概念
数据流 缓存 UI组件 App模型
快速上手教程
前置要求 设置虚拟环境 导入Streamlit 添加应用标题 添加数据 使用魔术方法 绘制折线图 绘制地图 使用复选框切换数据的显示 使用列表选择框 将组件放在侧栏 显示进度
教程 - 数据浏览应用
创建应用 读取数据 缓存 查看原始数据 绘制直方图 在图上叠加数据 使用滑杆过滤结果 使用按钮切换数据 整合
教程 - 远程运行Streamlit
准备工作 SSH及端口转发 在云实例上安装Streamlit 远程运行你的代码 编辑远程脚本
高级概念
数据显示与样式 插入编外数据 元素动画效果 向图表添加数据 返回Stream调用的值 高级缓存
API参考手册
魔术方法 st.title - 显示应用标题 st.header - 显示主标题 st.subheader - 显示副标题 st.text - 显示文本 st.markdown - 显示markdown文本 st.code - 显示代码块 st.write - 通用显示方法 st.dataframe - 显示可交互数据帧 st.table - 显示静态数据表 st.json - 显示JSON对象 st.pyplot - 显示matplotlib图表 st.altair_chart - 显示Altair图表 st.vega_lite_chart - 显示vega-lite图表 st.plotly_chart - 显示plotly图表 st.bokeh_chart - 显示Bokeh图表 st.deck_gl_chart - 显示Deck.GL图表 st.graphviz_chart - 显示graphviz图表 st.line_chart - 显示折线图 st.area_chart - 显示区域图 st.bar_chart - 显示棒状图 st.map - 显示地图 st.image - 显示图像 st.audio - 显示音频播放器 st.video - 显示视频播放器 st.button - 显示按钮 st.checkbox - 显示复选框 st.radio - 显示单选框 st.selectbox - 显示列表选择框 st.multiselect - 显示列表多选框 st.slider - 显示滑动拉杆 st.text_input - 显示文本输入框 st.number_input - 显示数字输入框 st.text_area - 显示多行文本输入框 st.date_input - 显示日期输入框 st.time_input - 显示时间输入框 st.echo - 显示应用源代码 st.progress - 显示进度 st.spinner - 显示执行状态 st.balloons - 显示庆祝气球 st.error - 显示错误信息 st.warning - 显示警告信息 st.info - 显示提示信息 st.success - 显示成功信息 st.exception - 显示异常信息 st.empty - 添加占位符 st.help - 显示帮助信息 st.get_option - 读取配置项的值 st.set_option - 设置配置项的值 st.cache - 函数缓存装饰器 dg.add_rows - 追加数据行
命令行参考手册
streamlit help - 查看帮助信息 streamlit run - 运行应用 streamlit config show - 查看配置选项 streamlit cache clear - 清理缓存 streamlit docs - 查看文档 streamlit version - 查看版本
常见问题解答
如何更改端口?
在线工具推荐: Three.js AI纹理开发包 - YOLO合成数据生成器 - GLTF/GLB在线编辑 - 3D模型格式在线转换 - 可编程3D场景编辑器

st.vega_lite_chart - 显示Vega-Lite图表

streamlit的vega_lite_chart方法使用Vega-Lite库显示指定的图表。

方法原型

streamlit.vega_lite_chart(data=None, spec=None, width=0, **kwargs)

参数:

  • data:要显示的数据对象或Vega-Lite图表规格,数据类型可以是:
    • pandas.DataFrame
    • pandas.Styler
    • numpy.ndarray
    • Iterable
    • dict
    • None
  • spec:Vega-Lite的图表规格,如果在前面data参数已经传入图表规格,这里 必须传入None
  • width:宽度模式。0表示使用整个文档宽度,-1表示使用Veta-Lite的默认值。 大于0表示要设置的宽度像素。注意如果定义了spec['width'],那么这里的 设置无效
  • **kwargs:与spec参数相同,只是采用关键词参数

示例代码

>>> import pandas as pd
>>> import numpy as np
>>>
>>> df = pd.DataFrame(
...     np.random.randn(200, 3),
...     columns=['a', 'b', 'c'])
>>>
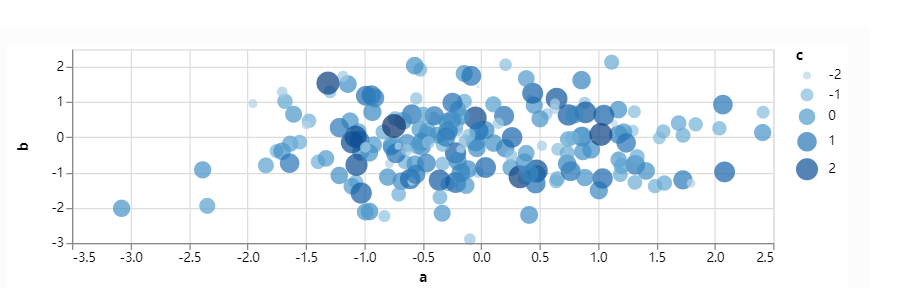
>>> st.vega_lite_chart(df, {
...     'mark': 'circle',
...     'encoding': {
...         'x': {'field': 'a', 'type': 'quantitative'},
...         'y': {'field': 'b', 'type': 'quantitative'},
...         'size': {'field': 'c', 'type': 'quantitative'},
...         'color': {'field': 'c', 'type': 'quantitative'},
...     },
... })

效果如下:

vega-lite